Protocol 3.2: Adhere to mapping standards
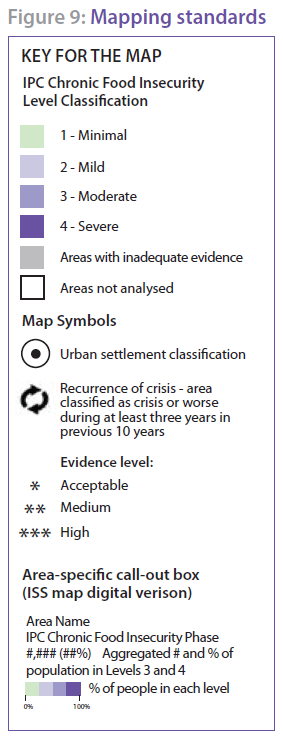
The following parameters need to be adhered to in all maps of IPC Chronic Food Insecurity Classifications (Figure 9):
- Areas should be mapped using the following RGB colour scheme: Level 1 (204, 255, 204); Level 2 (203, 201, 226); Level 3 (158, 154, 200); and Level 4 (106, 81, 163).
- Areas are classified and mapped only if they meet the minimum evidence requirements. If requirements are not met, these areas should be mapped using a grey colour (RGB 166, 166, 166), indicating inadequate evidence.
- Areas that are not included in the analysis should be coloured white (RGB 255, 255, 255), indicating “Area Not Analysed”.
- In case of classifications of urban areas, specific symbols should be used as illustrated in the legend. The colour of the symbol should be chosen according to the level classified.
- Evidence level of analysis should be added in the map for each area through the use of *Acceptable, **Medium and ***High. For areas experiencing a recurrence of crisis (Phase 3 or more severe during at least three years over the previous ten years), use the indicated symbol.
- Digital maps may have further information included in call-out boxes. This further information may include total population in Level 3 or more severe, and population distribution per level. Figure 53 includes extra information that can be added in digital maps.