Protocol 2.2: Compare Evidence against the IPC Acute Food Insecurity Reference Table
The purpose of the IPC Acute Food Insecurity Reference Table (“Acute Food Insecurity Reference Table) is to guide convergence of evidence by using generally accepted international standards and thresholds (Table 9).
The Acute Food Insecurity Reference Table is organized according to the IPC Analytical Framework – i.e. outcomes (food consumption, livelihood change, nutrition and mortality) and contributing factors (vulnerabilities and hazards, and the four dimensions of food security (Figure 5)), so that evidence can be critically evaluated, contextualized and related to different severities of food insecurity.
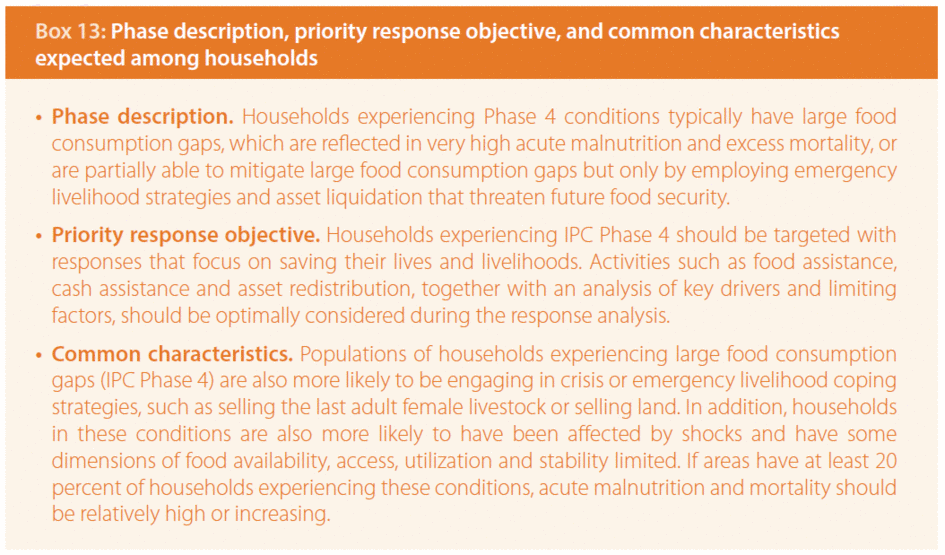
The Acute Food Insecurity Reference Table is organized into five severity phases (Phase 1: Minimal/None; Phase 2: Stressed; Phase 3: Crisis; Phase 4: Emergency; and Phase 5: Catastrophe/Famine). The Table provides a description of the typical characteristics for each phase and assumes that populations of households under each phase are likely to share the same general characteristics (Box 13).
Each phase is linked to priority response objectives. While the Reference Table links response objectives with each phase, it is necessary to conduct a response analysis subsequent to the completed analysis to effectively determine which particular interventions and activities are best suited to mitigate or prevent food insecurity.
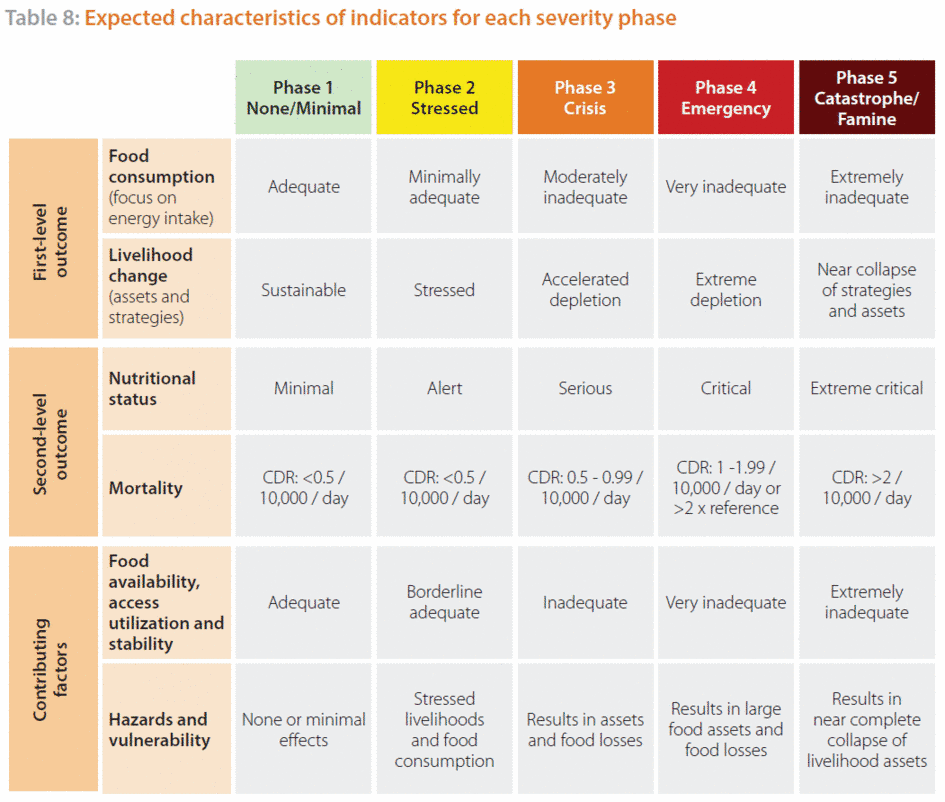
The Acute Food Insecurity Reference Table identifies generally comparable cut-offs for key food insecurity outcome indicators so that populations of households can be commonly distributed across the five phases (Table 8). Evidence for these indicators is known for the IPC as direct evidence. Although the IPC identifies ‘generally globally comparable’ cut-offs of indicators, it acknowledges that they may not always align due to context issues and indicator characteristics. Thus, while the Reference Table provides general guidance for evidence alignment, it is the convergence of evidence based on critical contextualization and understanding of indicator use and limitations that will allow analysts to conclude on classification. Analysts will be required to explain their reasoning for classification, including reference to supporting and contradictory evidence. Table 8 summarizes key expected characteristics of indicators for each phase, organized by food security elements.
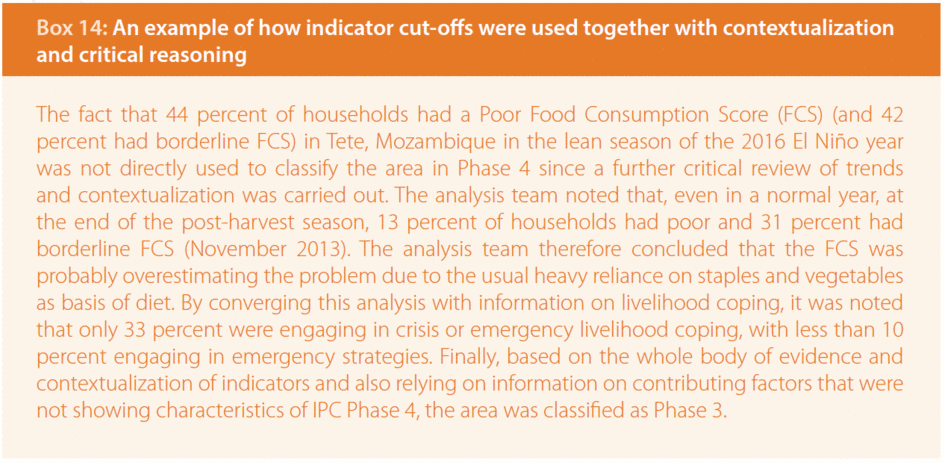
Although the IPC Reference Table identifies only selected indicators as direct evidence, it does not preclude the use of information from other indicators not included in the Table during the analysis (Box 14). In fact, IPC encourages the inclusion of other relevant indicators in the analysis. The IPC Reference Table is not for review at the country or regional levels. However, it may be updated by the global IPC partnership through the Technical Advisory Group, considering users’ feedback and the latest technical developments.
Indirect evidence includes all relevant evidence not listed in the IPC Reference Table, including locally specific indicators on outcomes and most indicators on contributing factors. Indirect evidence is usually available at subnational levels with greater frequency, since it often contributes to national monitoring systems. Furthermore, some of these locally specific indicators may have been calibrated for local conditions. Since the Table does not identify globally applicable cut-offs for indirect evidence, they need to be interpreted and analysed within their context. If, however, locally applicable cut-offs have been developed, analysts may refer to them. In the absence of locally applicable cut-offs, it is the task of the analysts to understand and infer the meaning of the evidence, and to relate it to the phase descriptions and other indicator cut-offs.
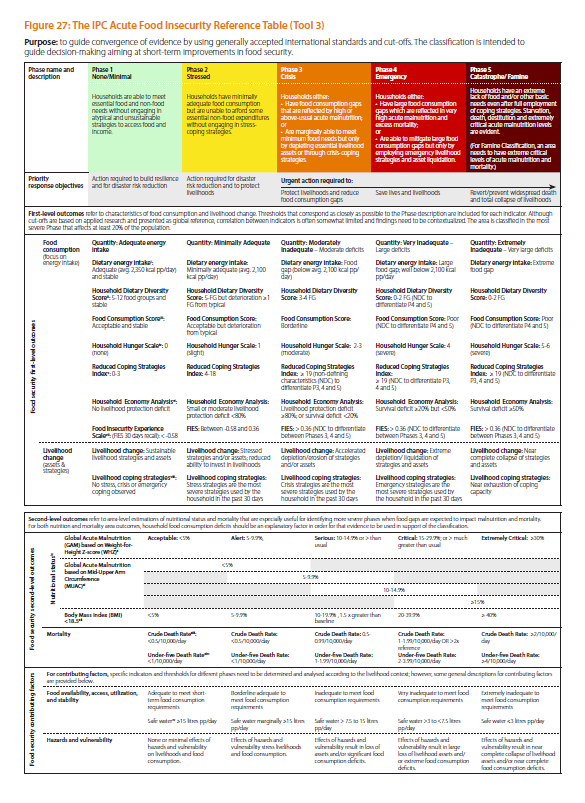
Table 9: IPC Acute Food Insecurity Reference Table
Purpose: to guide convergence of evidence by using generally accepted international standards and cut-offs. The classification is intended to guide decision-making aiming at short-term improvements in food security.
i. Adequate dietary energy intake relates to the condition of regularly consuming, over a relevant period of time, an amount of food that provides the dietary energy needed to cover the requirements for an active and healthy life. Dietary energy intake is used as a convention and convenience to assess the average energy requirements for a population group. Characteristics that affect requirements include gender, age, body size, body composition and physical activity level as well as unknown factors that produce variations among individuals, as defined by the World Health Organization (WHO, 1985). The energy cut-offs included in the IPC Acute Food Insecurity Reference Table are not intended to be used for empirical assessment of percentage of the population consuming adequate/inadequate amounts of food, but rather, the indicator acts as a reference for food consumption, and the cut-off of 2,100 kcal/day is associated with the Household Economy Analysis (HEA) survival deficit cut-off and borderline FCS. The selected dietary energy requirements for the Acute Food Insecurity Reference Table are based on average requirements for an average individual (BMI of 21–22), engaged in normally active life (physical activity level, or physical activity level = 1.75) for Phase 1, with an of average 2,350 Kcal/day, and in a sedentary lifestyle (physical activity level=1.55) for Phase 2 (FAO, WHO and United Nations University, 2004) with an average of 2,100 Kcal/day.
ii. The Household Dietary Diversity Score (HDDS) is an indicator developed by Food and Nutrition Technical Assistance (FANTA) and promoted by FAO. It aims to reflect the economic ability of a household to access a variety of foods and is based on households’ self-reporting of the number of food groups consumed in the previous 24 hours. IPC cut-offs have been prepared for HDDS with 12 food groups, based on FANTA/FEWS NET Household Food Consumption Indicator Study (2015).
iii. The Food Consumption Score (FCS) is a WFP corporate indicator collected in all assessments and monitoring activities. The FCS is a composite score based on self-reported information on consumed food groups (of nine food groups in total) and food frequency (number of days food groups were consumed during the past seven days), weighted by the ascribed relative nutritional importance of different food groups. Based on standard thresholds, households are classified into one of three food consumption groups: poor, borderline, or acceptable, with scores of ≤21, 28 and 35, respectively, except in situations of high oil and sugar consumption, for which the cut-offs used for the same groups are ≤28, 35 and 42, respectively. These same groupings are used as cut-offs for different phases in the IPC Acute Food Insecurity Reference Table.
iv. The Household Hunger Scale (HHS) is an indicator developed by FANTA. It assesses whether households have experienced problems of food access in the preceding 30 days, as reported by the households themselves, to classify the severity of food insecurity for that period. HHS assesses food consumption strategies adopted by households facing a lack of access to food. The cut-offs for the HHS are based on the FANTA/FEWS NET Household Food Consumption Indicator Study report, and alignment with the Acute Food Insecurity Reference Table phase descriptions.
v. The reduced Coping Strategies Index (rCSI) developed by CARE International is an experience-based indicator collecting information on household use and frequency of five different food-based coping strategies over the past 7 days. It is thought to be most useful in early onset crises when households change their food consumption patterns to respond to shocks, but not in protracted emergencies when households are likely to have already exhausted some coping mechanisms. The rCSI cut-offs are based on FANTA/FEWS NET Household Food Consumption Indicator Study report and validation conducted by WFP.
vi. The Household Economy Analysis (HEA) is a livelihoods-based framework founded on the analysis of people in different social and economic circumstances. In particular, the HEA examines the self-reporting of information on: (i) how people access the food and cash they need; (ii) their assets, the opportunities available to them, and the constraints they face; and (iii) the options open to them in times of crisis. Two thresholds define basic needs in the HEA: the Survival Threshold and the Livelihoods Protection Threshold. The HEA Survival Threshold represents the most basic needs, including minimum food energy requirements (calorie requirements), the costs associated with food preparation and consumption if associated inputs are purchased (such as salt, firewood or kerosene [paraffin]), as well as expenditure on water for human consumption. All HEAs should consider the extent of reversible coping that is possible. HEA deficits generated by baseline analysis are presented in the Acute Food Insecurity Reference Table with cut-offs that reflect the expected situation in terms of livelihood stress and food gaps, as explained in IPC phase descriptions.
vii. Food Insecurity Experience Scale (FIES) cut-offs are common, normalized thresholds developed specifically for use with the FIES 30 day-recall in the IPC Acute Food Insecurity Reference Table. These thresholds do not correspond to those defined for use of FIES in the context of SDG monitoring and in the IPC Chronic Food Insecurity Reference Table, which are different and based on a 12 month recall period. The threshold that identifies “moderate” food insecurity in the context of SDG monitoring is less severe than the one that identifies IPC Acute Phase 3 or worse. While the standard FIES including 8 questions (i.e. 8 items) does not include cut-offs to differentiate between Phases 3, 4 and 5, an extended version of the FIES has been created and preliminary findings indicate that this extended version might be able to better differentiate between Phase 3, Phase 4 and Phase 5. Use of available FIES extended data for analyses, this should be carefully applied as indirect evidence and only with support from the IPC Global Support Unit.
viii. Livelihood Coping Strategies (LCS) is an indicator developed by WFP and is derived from a series of questions regarding the household’s experience with livelihood stress and asset depletion due to lack of food or lack of money to buy food during the 30 days prior to the survey. The module needs to be adapted based on local context, both in terms of the strategies selected for data collection and the severity assigned to each strategy during analysis. For IPC Acute Food Insecurity, this indicator needs to be carefully analysed together with evidence on acute events and their impact on food security pillars (availability, access, utilization and stability). This indicator may have limited use in severe protracted crises, since households may have engaged in and exhausted specific activities prior to the recall period. Analysts should also consider that less vulnerable households may be more capable of changing livelihood strategies and asset levels, and thus may have a higher score, not because they are facing more severe food insecurity, but because they are more capable of responding to shocks (e.g. wealthier households are likely to have more savings, better access to loans, and animals to sell than poorer households). For the purpose of IPC Acute Food Insecurity classification, analysts should identify the most severe level of coping used by households. IPC cut-offs are based on groupings of strategies, i.e. stress, crisis and emergency strategies by WFP, depending on the strategies’ sustainability and potential negative impact on future livelihoods and food security of the household.
ix. Nutritional status and mortality are used to support classification of acute food insecurity due to the expected linkages between severity of food deprivation and acute malnutrition and mortality. Household food consumption deficits must be a likely explanatory factor of acute malnutrition and mortality in order for this evidence to be used in support of a phase classification. For example, elevated malnutrition due to disease outbreak or lack of access to health care should not be used as evidence for an IPC Acute Food Insecurity Analysis if it is determined to not likely be related to food consumption deficits. Similarly, excess mortality rates due to trauma-related deaths should not be used as evidence for Acute Food Insecurity Phase classification. A complementary IPC for Acute Malnutrition has been developed to inform decision-makers of severity and likely drivers of acute malnutrition.
x. Global acute malnutrition based on eight-for-eight Z-score (GAM based on WHZ) is defined as the percentage of children under five who are below -2 standard deviations of median of weight for height (<-2 WHZ) or presence of oedema. Cut-offs are derived from WHO guidance, as well as from the Review of Nutrition and Mortality Indicators for the IPC -study (2009).
xi. Global Acute Malnutrition based on mid-upper arm circumference (GAM based on MUAC) is defined as the percentage of children under five who have readings below 125 mm or the presence of oedema. Although GAM based on MUAC is a common measure of acute malnutrition, especially in emergency settings when the IPC Acute Food Insecurity classification is most relevant, global thresholds have not been developed. Evidence on GAM based on MUAC is included in the IPC so that evidence use is maximized, especially in emergency settings. The IPC acknowledges that concordance between MUAC and WHZ varies depending on context and is usually around 40–50 percent. The MUAC thresholds endorsed by the IPC have been developed based on extensive research by the Centers for Disease Control and Prevention and the JRC on the specificity and applicability of MUAC for the detection of GAM prevalence at the population level. MUAC thresholds can only be used in conjunction with the other contextual information by taking into account immediate causes of acute malnutrition and the locally understood relationship between MUAC and WHZ prevalence, and by using the convergence of evidence approach.
xii. The Body Mass Index (BMI) measures central body mass and is an indicator of weight in relation to height. BMI is typically collected on non-pregnant women between 15 and 49 years of age. The IPC thresholds are based on the percentage of people with scores of 18.5. The thresholds use the WHO reference cut-offs that have been adopted by the IPC.
xiii. The crude death rate (CDR) is an indicator that accounts for all deaths that have occurred per day per 10,000 people over a given recall period (often 90 days) in an area or in a community. According to the IPC Acute Food Insecurity Analysis, CDR should not include trauma-related deaths, but should include deaths due to unknown causes. IPC cut-offs are based on WHO guidance, as well as on the Review of Nutrition and Mortality Indicators for the IPC study (2009).
xiv. The under-five death rate (U5DR) refers to all deaths of children under five (up to 59 months) per 10,000 children under five per day over a given recall period (often 90 days) in an area or in a community. The U5DR is typically around twice that of the CDR. U5DR should not include trauma-related deaths. The under-5 mortality rate (i.e. the probability of dying between birth and the fifth birthday per 1,000 live births) can be used in order to understand the indicative U5DR, if the conditions between the collection of data for the under-5 mortality rate and the current situation have not changed.
xv. Access to safe water of ≥15 litres per person per day and further severity cut-offs per day per person for other phases are based on Sphere guidance for emergency situations. However, exact information on water quantity is rarely available outside camp settings or other situations where access to water is monitored. There are certain differences in cut-offs of the water indicator between IPC Acute and Chronic Food Insecurity Reference Tables. The cut-offs in the IPC Chronic Food Insecurity Reference Table (except for the 15 litres per person per day) are based on agreement with other indicators, assuming that households that are more chronically food insecure also have compromised access both to sufficient quantity of water and to potable water. However, access to a sufficient amount of water in a chronic (i.e. long-term) situation is not expected to be as problematic as it can be in an acute emergency, and therefore, no further severity cut-offs have been determined for the IPC Chronic Food Insecurity Reference Table, whereas they have been included in the IPC Acute Food Reference Table.
Non-defining characteristic (NDC) is included for some indicators in the IPC Acute Food Insecurity Reference Table when no cut-offs were identified to differentiate between some Phases. For example, given that a “poor” FCS is indicative of Phases 4 and 5 (since it is a NDC to differentiate between Phases 4 and 5), the proportion of households with a “poor” score should be indicative of the proportion of households in Phases 4 and 5.