Protocol 2.4: Evaluate evidence reliability
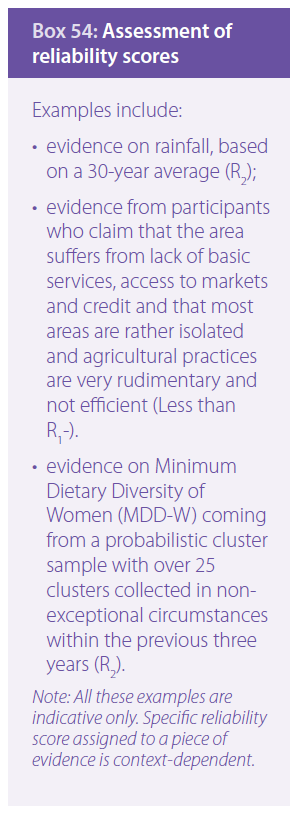
The evidence to be used in the IPC consists of available data, and the final classification is obtained based on a comprehensive, integrated analysis of the whole body of available evidence. Hence, all evidence needs to be evaluated for its reliability, including evidence coming from quantitative methods, such as surveys, as well as from qualitative methods, such as focus group discussions. Evidence to be assessed includes all evidence on contributing factors, for example, satellite images, price trends, food production, rainfall estimations and employment levels, as well as evidence on outcomes, such as food consumption quality and quantity (Box 54).
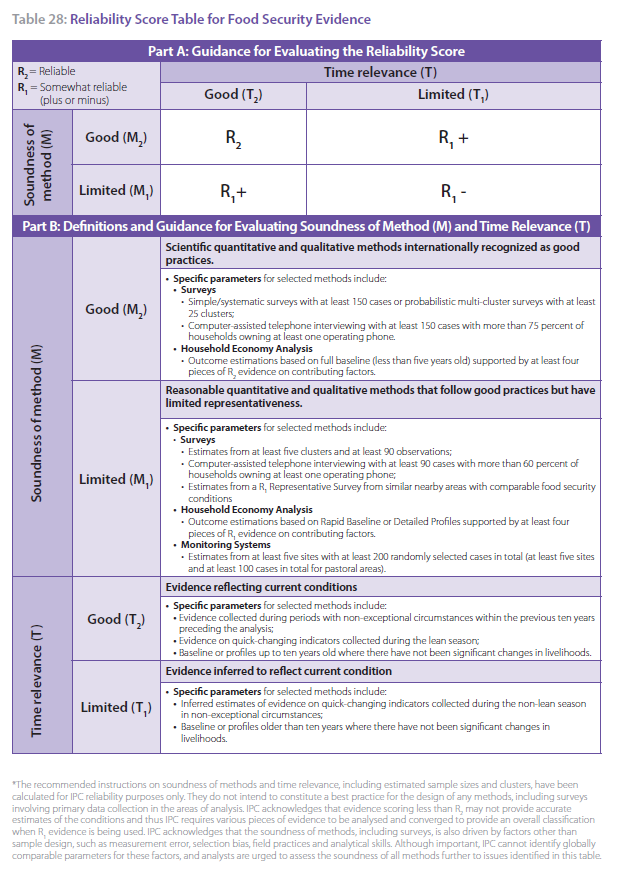
Evidence used in IPC can have a Reliability Score of R2= reliable; or R1= somewhat reliable. R1 is further divided into two scores: (i) R1+ refers to evidence that has either limited soundness of method or time relevance; and (ii) R1- refers to evidence that has both limited soundness of method and time relevance. The assessment of reliability is not based on a statistically rigorous process, but rather on a general assessment of the soundness of methods of data collection and analysis (M) and the time relevance of the evidence (T).
The IPC Reliability Score Table (Table 28) presents the general criteria for assessing reliability scores as well as the more specific guidance to assessment of the soundness of method and time relevance for all food security evidence as follows:
- Part 1 presents the combination of M and T that underpin the different reliability scores. Evidence is reliable when the method used is robust and evidence depicts ongoing conditions. If evidence is yielded from a reasonable but less rigorous method, such as those with limited representativeness, the evidence can be at most R1. Both quantitative and qualitative methods can potentially be assigned as R2.
- Part 2 presents the general working definition of “good” and “limited” soundness of method (M) and time relevance (T) as well as specific guidance for assessment of reliability of evidence on indicators included in the Reference Table.
Considerations:
1. General criteria for assessment of evidence reliability are equally applicable to all evidence, including qualitative and quantitative data on indicators in the IPC Reference Tables (i.e. direct evidence) and on other indicators not included in the IPC Reference Tables (i.e. indirect evidence, such as market prices, rainfall estimates and production figures). Although all evidence used for IPC Classifications can be assigned a reliability score, IPC provides specific guidance only for indicators included in the IPC Reference Tables. Analyst are encouraged to use the general criteria to support evaluation of evidence on other indicators not included in the IPC Reference Table.
2. Nutrition evidence should be evaluated as per Criteria for Reliability Scores assessment included in the IPC Acute Malnutrition protocols. Surveys refer to studies of a geographical area or household group to gather data on food security outcomes and/or contributing factors, and are performed by polling a random section of the population or through universal census.
- The sample size for surveys with cluster sampling design will generally depend on the following parameters: P: expected prevalence, D: desired precision, d: design effect, Z: desired confidence level of estimations, and, only for populations less than 10,000, the population size. The sample formula: n ≥ d [Z2 (P) (1-P) / D2] applies to simple random and cluster sampling. However, in simple random sampling design effect (d) is 1, whereas d of cluster sampling will vary between surveys, often ranging between 1.5 and 2.5. To support evaluation of method validity of surveys, IPC refers to Sphere and Standardized Monitoring and Assessment of Relief and Transition Survey guidance of 25 clusters as “good” sample size. While 25 clusters can be generally applied globally as the large sample size allows for most conditions, an acceptable minimum sample size cannot be globally developed since it will depend on actual P (expected prevalence), d (design effect) and D (desired precision). Nevertheless, assuming general parameters of P:20 percent (following IPC’s 20 percent rule for area classification), D: 8.5 percent, d: 1.5 and Z:1.65 (90 percent desired confidence level of estimates), IPC has identified the need for five clusters and 90 observations as the minimally acceptable sample size, what is labelled as “limited”. Although analysts may use the minimum sample size of five clusters and 90 observations as acceptable minimum sample size, IPC analysts should revise the minimum sample size based on real parameters as much as possible, although the desired precision (D) cannot be greater than 8.5 percent.
- The validity of surveys is also driven by factors other than sample design, such as measurement error, selection bias, field practices and analytical skills. Although important, IPC cannot identify globally comparable parameters for these, and analysts are urged to assess the representativeness of the surveys.
- Surveys with a good method can only come from a census or a probabilistic randomized assessment with selection being based on an adequate sample frame. A good method also needs to adhere to minimum sample size above, have low measurement error and selection bias, and be collected with adequate field practices and analytical skills.
- Surveys with Limited Method can be: (i) a probabilistic assessments; (ii) a non-probabilistic assessments for various purposes; or (iii) re-analysed survey data collected with a Good Method valid at higher administrative unit. Surveys with limited representativeness should still meet minimum sample size requirements for 8.5 percent precision and have a low measurement error and selection bias, and be administered with adequate field practices and analytical skills. Given that estimates from surveys with lower sample size are likely to generate large confidence intervals, field data collectors are urged to conduct surveys representative of the unit of analysis. IPC also calls for care when disaggregated evidence is used as information generated can be misleading especially if selection bias and heterogeneity are large. As much as possible, as a best practice, estimates should be provided with confidence intervals to support responsible use of this evidence.
3. Computer-assisted telephone interviewing - based surveys are conducted remotely by trained specialized operators who work from a call centre and interview randomly selected respondents. Computer-assisted telephone interviewing can be used either as a survey or as a monitoring system. In principle, the same sample size that would be applicable to face-to-face surveys and monitoring systems should be applied to computer-assisted telephone interviewing assessments. However, an increase of 1.5x should be applied if selection bias needs to be corrected for the increased design effect. In order to be accepted for IPC Classification, computer-assisted telephone interviewing questionnaire modules need to also be tested and approved, considering the challenges imposed on operators by not being in direct physical presence with the respondents. Optimally, especially in areas where there is bias associated with phone-ownership, it is best to use both computer-assisted telephone interviewing and face-to-face interviews with a 10 percent sample overlap to check for mode-biases between the two approaches and produce reliable estimates for variance. Unless the computer-assisted telephone interviewing is used within a dual mode (computer-assisted telephone interviewing + face-to-face) survey or the phone numbers come from a previous cluster-sample survey, computer-assisted telephone interviewing follows a simple stratified random sample design, and therefore do not require cluster selection and requisites.
4. Full Household Economy Analysis (HEA) refers to estimations of livelihood and survival deficts carried out by a trained professional using either the Livelihoods Impact Analysis Spreadsheet or the Dashboard. The full analysis and assumptions need to be well documented and available for review by the IPC Technical Working Group and eventual IPC Quality Review. Full baselines are based on approximately 50 focus group and key informant interviews, and should be relevant at the time of the analysis considering the stability of the situation: not older than ten years in stable situations, and not older than five years in unstable situations. Analysis needs to be supported by at least four pieces of R2 evidence on contributing factors. The HEA needs to adhere to the best practice checklist.
5. Rapid Household Economy Analysis (HEA) refers to estimations of outcomes carried out by a trained professional using a less complete analysis system, such as the Scenario Building Tool or the Dashboard. Both rapid baselines and rapid profiles belong to this category although there are differences between the two: rapid baselines are based on approximately 30 focus group and key informant interviews, and use the Dashboard for the provision of detailed estimates, whereas rapid profiles are based on eight to ten focus group and key informant interviews, and use the Scenario Development tool for rough estimations of outcomes. Analysis and assumptions need to be well documented and made available for review by the IPC Technical Working Group and potential IPC Quality Reviews. Reference values can be obtained from rapid baselines or rapid profiles provided that they quantify sources of food and income for subjects being classified. Rapid baselines and detailed profiles should be relevant at the time of the analysis considering the stability of the situation: not older than ten years in stable situations, and not older than five years in unstable situations. Analysis needs to be supported by at least four pieces of R2 evidence on contributing factors. The HEA needs to adhere to the best practice checklist. The ‘zone summaries’ or equivalents, which are also based on the concepts of HEA but which do not provide detailed information on food and income sources score less than R1.
6. Monitoring systems include estimates usually collected routinely in community based sites purposively selected with prevalence statistics usually carried out through pooled analysis for surveillance and monitoring. Observations may be selected randomly or purposively for various reasons.
7. Evidence collected during non-exceptional circumstances refers to food security data collected during the period of time defined as the non-exceptional period considering usual and unusual shocks. If a usual or typical shock has taken place during the data collection period, the evidence can still be rated as having “good” time validity, since the time period of data collection reflects non-exceptional conditions. If, however, an unusual shock (e.g. severe drought, flooding) occurred during the data collection period, the evidence does not reflect typical underlying conditions. In these situations, it is preferable not to use the evidence in the IPC Chronic Food Insecurity Analysis. If, however, available evidence from non-exceptional circumstances is scarce and the evidence collected during exceptional circumstances can be reasonably inferred to non-exceptional circumstances, evidence can be used to support the analysis but cannot be rated even R1.
8. Evidence on quick-changing indicators is evidence on indicators that tend to change fast, for example, seasonally, and that typically have a short recall period). For example, most food consumption indicators belong to quick-changing indicators. The cut-offs of the quick-changing indicators included in the IPC Chronic Food Insecurity Reference Table have been calibrated for the lean season, and as a result, evidence collected over the lean season is considered to have good time relevance (T2). If, however, evidence has been collected over a non-lean season, evidence on quick-changing indicators can receive maximum T1 for time relevance.