Protocol 3.1: Produce the IPC Analysis Report
At the conclusion of the analysis process, the analysis team should draft the key messages to be included in the report. The IPC Analysis Report outlined below should be finalized and released preferably within 15 days of the completion of analysis. Any IPC analysis reporting should contain the minimum information as per Table 14.
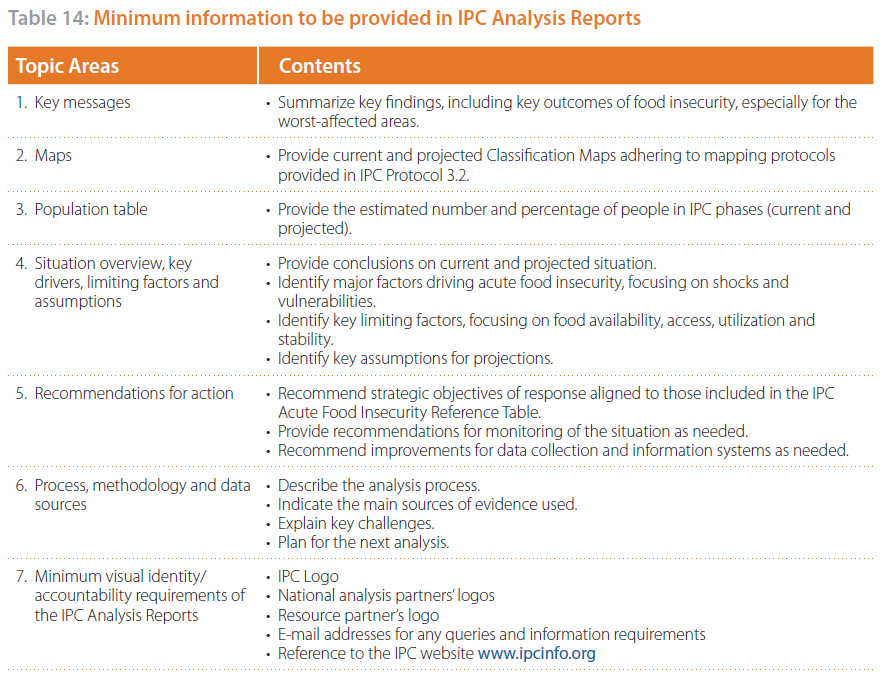
If the IPC Acute Food Insecurity Analysis and the IPC Acute Malnutrition Analysis are conducted simultaneously, it is highly recommended that one report be produced combining the analyses results.
The IPC Modular Communication Template
The IPC Modular Communication Template provides a standard format and content guide for developing IPC Analysis Reports. The Template has been developed to meet the different interests and needs of a variety of IPC stakeholders while ensuring that the minimum requirements for communicating IPC results are met. By using the Template, IPC Analysis Reports effectively communicate key findings in a clear, concise, accessible and consistent format.
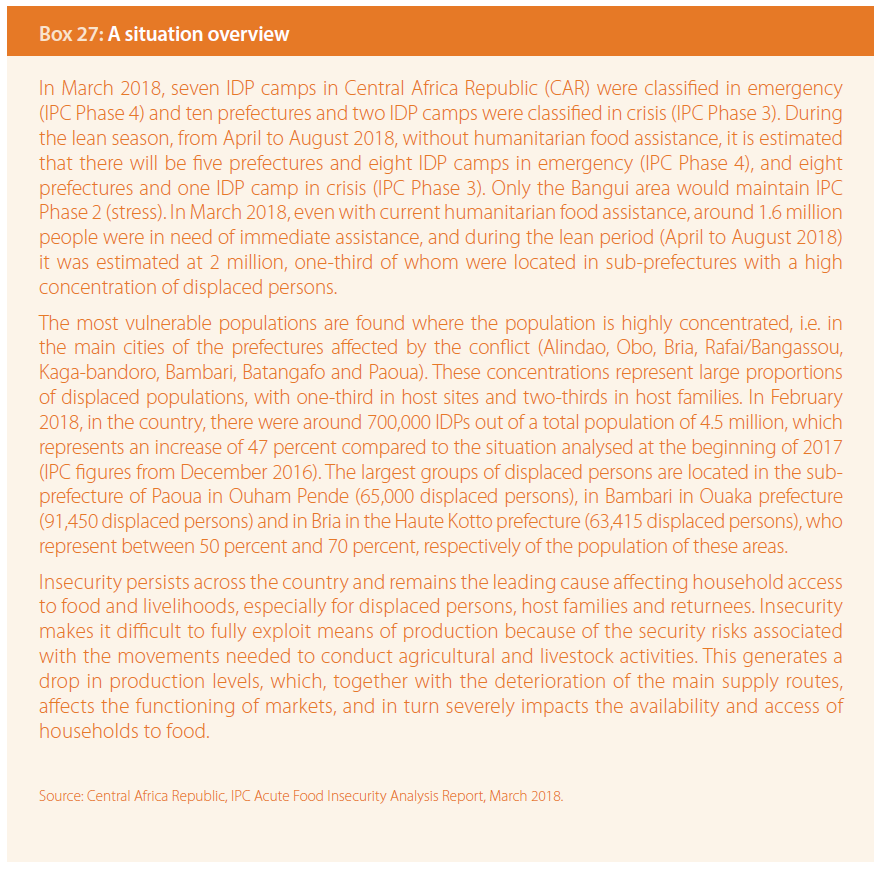
The Modular Communication Template for Acute Food Insecurity consists of nine modules: (1) Key facts and messages; (2) Classification maps and the Summary Population Table; (3) Situation overview, key drivers and limiting factors (Box 27); (4) Recommendations for action; (5) Detailed Population Table(s); (6) Process, methodology and data sources; (7) Results in figures; (8) Profiles of the most affected areas/groups; and (9) Results of other IPC classifications.
General guidelines for completing the IPC Acute Food Insecurity Modular Communications Template include the following:
- All modules of the template should be completed. The full IPC Analysis Report should at least include Modules 1 through 6; Modules 7 to 9 are optional.
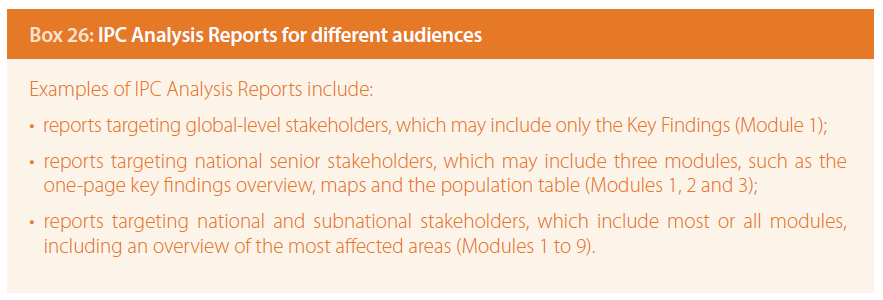
- Modules can be selected and combined to develop specific products that meet the needs of different stakeholders. See Box 26 for examples of selection of modules for different audiences.
- Modules are designed to ensure consistent IPC branding as well as ownership. Key information should be provided, e.g. name of the country, contacts, institution housing IPC, resource partners and logos of the analysis partners.
- The IPC Integrated Food Security and Nutrition Modular Communication Template is available and should be used to produce a report combining Acute Food Insecurity and Acute Malnutrition results.
- The IPC Modular Communication Template can be developed in the ISS or offline.
- The use of the IPC Modular Communication Template does not prevent countries from producing further documents or incorporating IPC results in other documents.
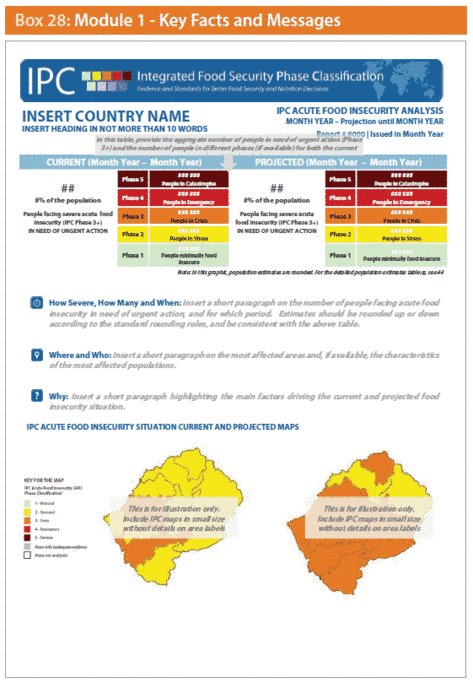
Module 1: Key facts and messages
Purpose: To provide concise responses to the key six questions: how severe, how many, when, where, who and why (Box 28).
Key information:
- Aggregated population tables: Provide the aggregate number of people in different phases (if available) for both the current and projected periods. The number of people in need of urgent action further to received action (i.e Phase 3 or worse) is highlighted.
- How severe, how many and when? Refer to the number of people facing Acute Food Insecurity in need of urgent further action, and for which period.
- Where and who? Identify the most affected areas and, if available, the characteristics of the most affected populations.
- Why? Highlight the main factors driving the current and projected food insecurity situation.
- Current and projected situation maps: Include small IPC maps without details on area labels and limit extra symbology as suitable.
Note that, in this module, population estimates in the table and in the narrative (how many) should be rounded up or down according to the standard rounding rules, for example, analysts may chose to round to the nearest one thousand (‘000) people.
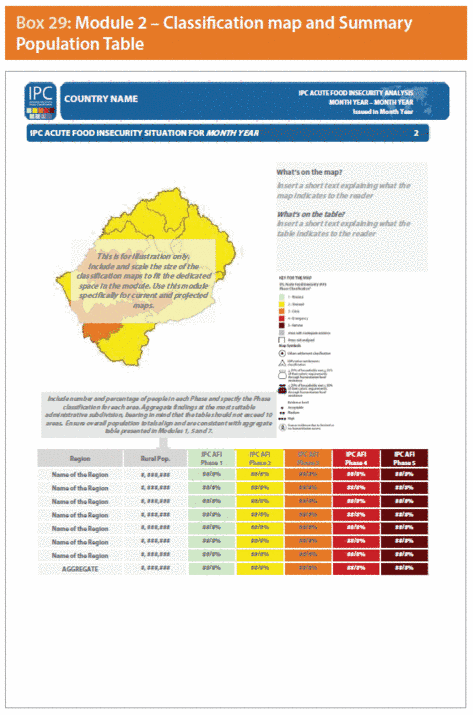
Module 2: Classifications maps and Summary Population Tables
Purpose: To provide larger-scale, more detailed classification maps (for both current and projected) and summary tables of population estimates (Box 29).
Key information:
- Classification maps: Include and scale the size of the classification maps to fit the dedicated space in the module. Use this module specifically for current and projected maps. Insert a short text explaining what the maps indicate to the reader.
- Summary population tables: Use the template or develop summary population tables for current and projected classifications to be added below the respective maps. Include number and percentage of people in each phase and specify the phase classification for each area if findings have not been aggregated. If more than ten areas are classified, aggregate findings at the most suitable administrative sub-division unit level, bearing in mind that the table should not exceed ten to fifteen areas (consider aggregating by regions if necessary). Ensure that overall population totals align and are consistent with the aggregate table presented in Modules 1, 5 and 7 (if developed).
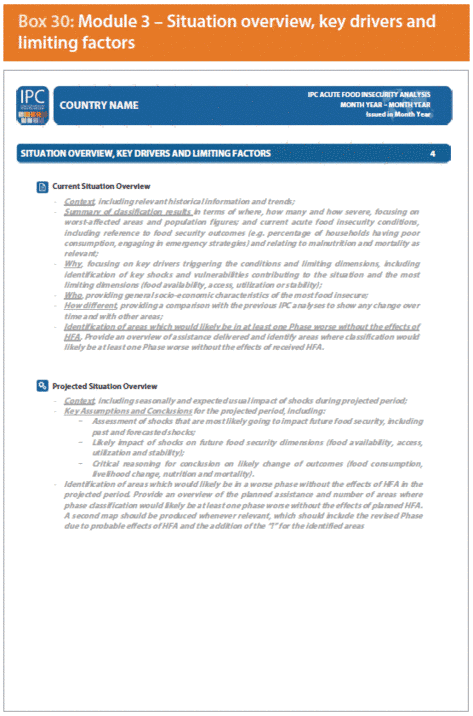
Module 3: Situation overview, key drivers and limiting factors
Purpose: To provide more detailed analysis of current and projected classification considering the six key questions of how severe, how many, where, when, why, and who, already summarized in Module 1 (Box 30).
Key information:
- Current situation overview, considering:
- the context, including relevant historical information and trends;
- the summary of classification results in terms of where, how many and how severe, focusing on worst-affected areas and population figures; and current Acute Food Insecurity conditions, including reference to food security outcomes (e.g. percentage of households having poor consumption, engaging in emergency strategies) and relating to malnutrition and mortality as relevant;
- why? focusing on key drivers triggering the conditions and limiting dimensions, including identification of key shocks and vulnerabilities contributing to the situation and the most limiting dimensions (food availability, access, utilization or stability);
- who? providing the general socio-economic characteristics of the most food insecure populations;
- how different? providing a comparison with the previous IPC analyses to show any change over time and with other areas;
- Identification of areas that received significant humanitarian food assistance and provide a brief overview of assistance delivered.
- The projected situation overview, considering:
- context, including seasonally and expected usual impact of shocks during projected period;
- key assumptions and conclusions for the projected period, including:
- an assessment of shocks that will most likely impact future food security, including previous and forecasted shocks and their;
- likely positive or negative impact on future food security dimensions (food availability, access, utilization and stability);
- critical reasoning for conclusion on likely change of outcomes (food consumption, livelihood change, nutrition and mortality).
- Identification of areas that will likely receive significant humanitarian food assistance based on reviewed existing plans that have either been funded or will likely be funded, with planned assistance likely to be delivered. Provide an overview of the key characteristics of the plans.
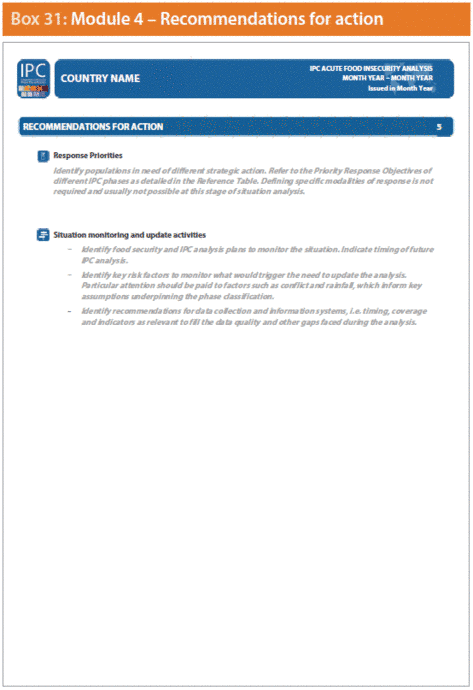
Module 4: Recommendations for action
Purpose: To provide general recommendations for: (i) response priorities; (ii) situation monitoring and plans for analysis updates; and (iii) data collection and information system (Box 31).
Key information:
- Response priorities:
- Identify populations in need of different strategic action. Refer to the priority response objectives of different IPC phases as detailed in the Acute Food Insecurity Reference Table. Defining specific modalities of response is not required and usually not possible at this stage of situation analysis.
- Situation monitoring and analysis updates:
- Identify IPC and other plans to monitor the situation. Indicate timing of future IPC analysis.
- Identify key risk factors to monitor that would trigger the need to update analysis. Particular attention should be paid to factors such as conflict and rainfall, which inform the key assumptions underpinning the phase classification.
- Identify recommendations for data collection and information systems, i.e. timing, coverage and indicators that are relevant to fill data quality gaps and inadequacies that may emerge during the analysis.
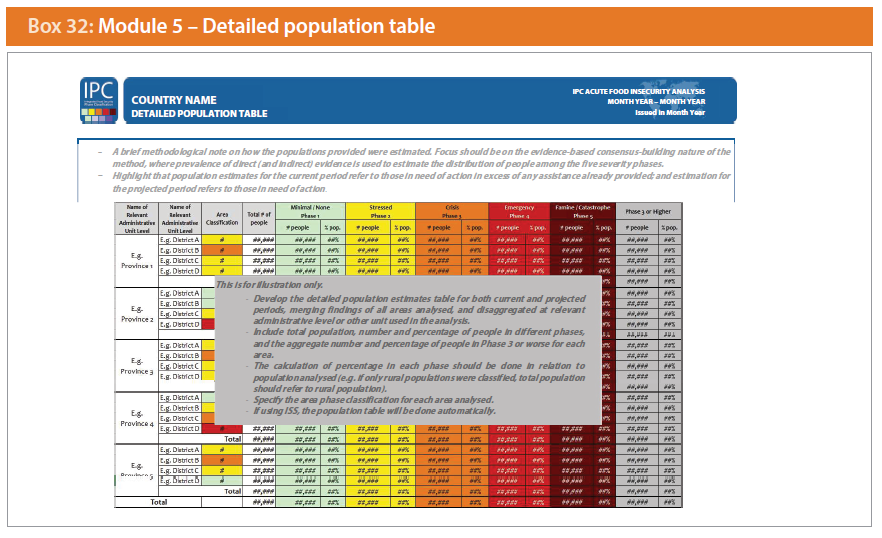
Module 5: Detailed population table(s)
Purpose: To develop and share the population estimates for different phases for current and projected periods (Box 32).
Key information:
- Overview of methods for population estimates:
- A brief methodological note on how the populations were estimated. Focus should be on the evidence-based consensus-building nature of the method where direct and indirect evidence is used to estimate the distribution of people among the five severity phases.
- Highlight the fact that population estimates for the current and projected periods refer to those in need of action in addition to anyaction already provided or planned to be provided. (Refer to p. 32–33 for detailed guidance.)
- Population Table:
- Develop the detailed Population Tables for both current and projected periods, detailing findings of all analysed areas, and disaggregated at the relevant administrative level or other unit used in the analysis.
- Include total population, number and percentage of people in different phases, and the aggregate number and percentage of people in Phase 3 or more severe for each area.
- The percentage in each phase should be calculated in relation to the population analysed (e.g. if only rural populations were classified, total population should refer to rural population).
- Specify the area phase classification for each area analysed.
- Add the following note below the table: A population in Phase 3+ does not necessarily reflect the full population in need of urgent action. This is because some households may be in Phases 2 or even 1 but only because of receipt of assistance, and as a result they may be in need of continued action.
- When ISS is used, the population table will be generated automatically.
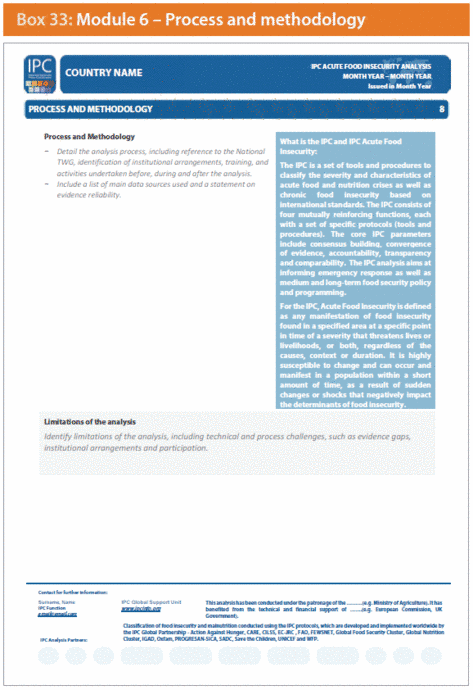
Module 6: Process and methodology
Purpose: To describe the IPC approach, analysis process, main data sources and key limitations (Box 33).
Key information:
- Process and methodology
- Detail the analysis process, including reference to the National Technical Working Group, including identification of institutional arrangements, training, and activities undertaken before, during and after analysis.
- Include a list of the main data sources used.
- Limitations of the analysis:
- technical and process challenges, such as evidence gaps, institutional arrangements and participation.
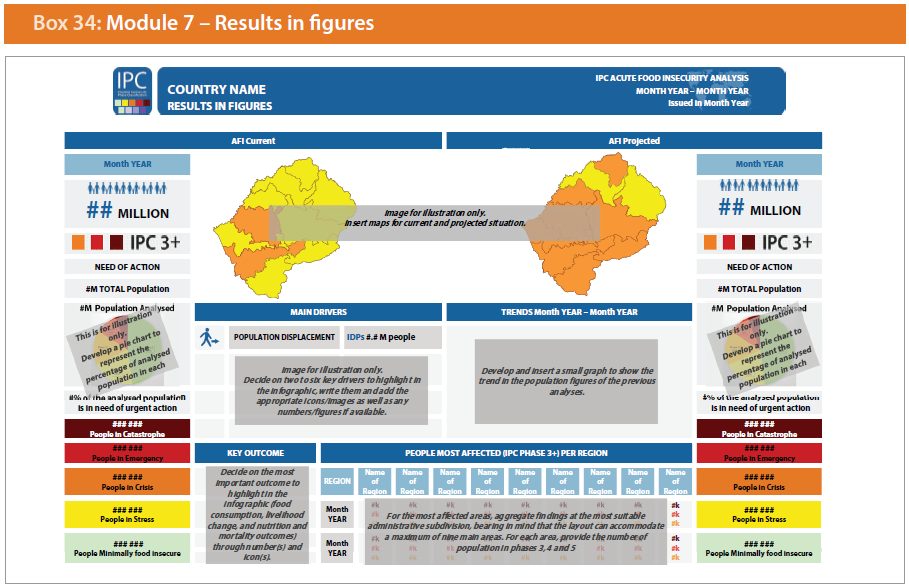
Module 7: Results in figures
Purpose: To present key results in easily accessible infographics (Box 34).
Key information:
Graphic visual representation of the most important results/information of the IPC analysis for the current and projected period (if available), specifically:
- IPC map(s).
- Population figures: Insert the total number of population in Phase 3 or more severe (i.e. Phase 3+) rounded as in module 1. Insert the total number of population analysed and develop a pie chart to represent the percentage of analysed population in each phase. Provide a break-down of the population figures in the different phases rounded as in module 1.
- Key drivers: Identify two to six key drivers to highlight in the infographic, include them and add the appropriate icons/images as well as any numbers/figures if available.
- Trends: If possible, develop and insert a small graph to show the trend in the population figures of the previous analyses.
- Key outcomes: Decide on the most important outcome to highlight in the infographic (food consumption, livelihood change, nutrition and mortality outcomes) through number(s) and icon(s). The layout may be adjusted to accommodate two key outcomes.
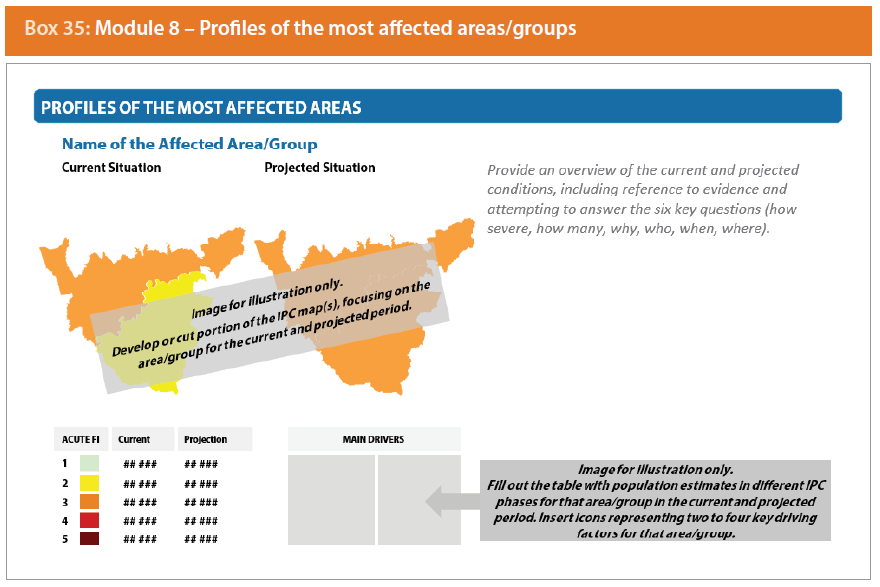
Module 8: Profiles of the most affected areas/groups
Purpose: To present key findings for each area or group of major concern (Box 35).
Key information:
- Provide an overview of the current and projected conditions, including reference to evidence aiming to answer the six key questions (how bad, how many, why, who, when, where). Provide recommendations for action as relevant.
- Develop or cut a portion of the IPC map(s), focusing on the area/group for the current and projected period.
- Fill out the table with population estimates in different IPC phases for that area/group in the current and projected period.
- Insert icons representing two to four key driving factors for that area/group.
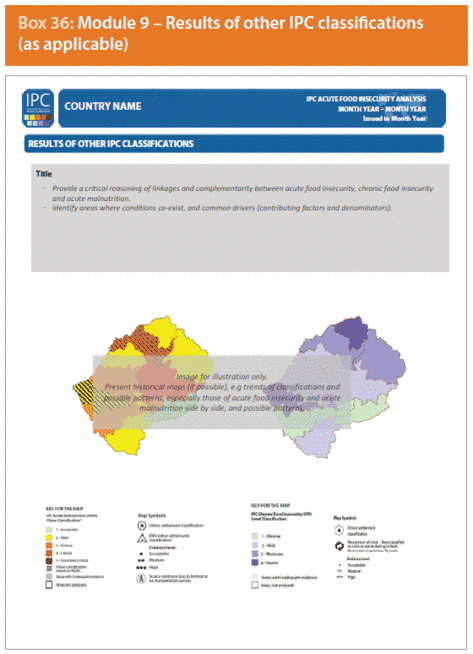
Module 9: Results of other IPC classifications (as applicable)
Purpose: To contextualize the current classification in relation to relevant IPC Acute Malnutrition and/or Chronic Food Insecurity classifications, presenting the linkages and complementarity between them, if possible. If previous Acute Food Insecurity classifications have been completed, trends over time can also be provided (Box 36).
Key information:
- Provide a critical reasoning of linkages and complementarity between Acute Food Insecurity, Chronic Food Insecurity and Acute Malnutrition.
- Identify areas where conditions and common drivers (contributing factors and denominators) co-exist.
- Present historical maps (if possible), for example, trends of classifications and possible patterns, especially those of Acute Food Insecurity and Acute Malnutrition in juxtaposition, and possible patterns.